
The Commodity Channel Index (CCI) measures how far an asset's price deviates from its average over a selected period. Traders use this technical indicator to assess market momentum, identify overbought and oversold conditions, and recognize potential trend reversals. Despite its name, the indicator can be applied to cryptocurrencies, forex, stocks, commodities, and other financial instruments.
How the CCI Works
To measure price deviations, the indicator compares an asset's typical price with its simple moving average (SMA). The result shows whether the price is trading above or below its recent average and how significant that deviation is relative to typical price fluctuations.
The calculation uses the following formula:
CCI = (Typical Price − SMA) / (0.015 × Mean Deviation)
Where:
-
Typical Price is the average of the high, low, and closing prices.
-
SMA is the simple moving average of the typical price over the selected period.
-
Mean Deviation is the average absolute difference between typical prices and their SMA over that period.
-
0.015 is a scaling constant.
A commonly used calculation period is 20 candles. Shorter periods make the indicator more sensitive to price changes, while longer periods produce smoother readings.
Interpreting CCI Values
Unlike oscillators with fixed boundaries, CCI values can extend beyond +100 and −100. Traders commonly use these levels to evaluate price deviations and momentum.
|
CCI Value |
Interpretation |
|
Above +100 |
Strong positive deviation; potentially overbought |
|
0 to +100 |
Price is above its recent average |
|
Around 0 |
Price is near its recent average |
|
−100 to 0 |
Price is below its recent average |
|
Below −100 |
Strong negative deviation; potentially oversold |
Extreme readings do not necessarily indicate an upcoming reversal. During strong trends, values may remain above +100 or below −100 for extended periods.
Using the CCI in Trading
Traders can use CCI readings to evaluate directional momentum and identify potential changes in market conditions. Two common approaches involve monitoring threshold crossings and comparing indicator movements with price action.
Identifying Momentum
A crossing above +100 may indicate strengthening bullish momentum, while a move below −100 may suggest increasing bearish momentum. These signals help traders assess the direction and strength of price movements. However, crossing a threshold does not guarantee that a trend will continue.
Spotting Potential Reversals
Divergence between price movements and indicator readings can suggest weakening momentum:
-
Bullish divergence: The price forms a lower low while the CCI forms a higher low, potentially indicating weakening selling pressure.
-
Bearish divergence: The price forms a higher high while the CCI forms a lower high, potentially indicating weakening buying pressure.
Although divergence may signal a possible reversal, traders typically look for confirmation from price action or other indicators before making trading decisions.
Adding CCI to the Trading Terminal
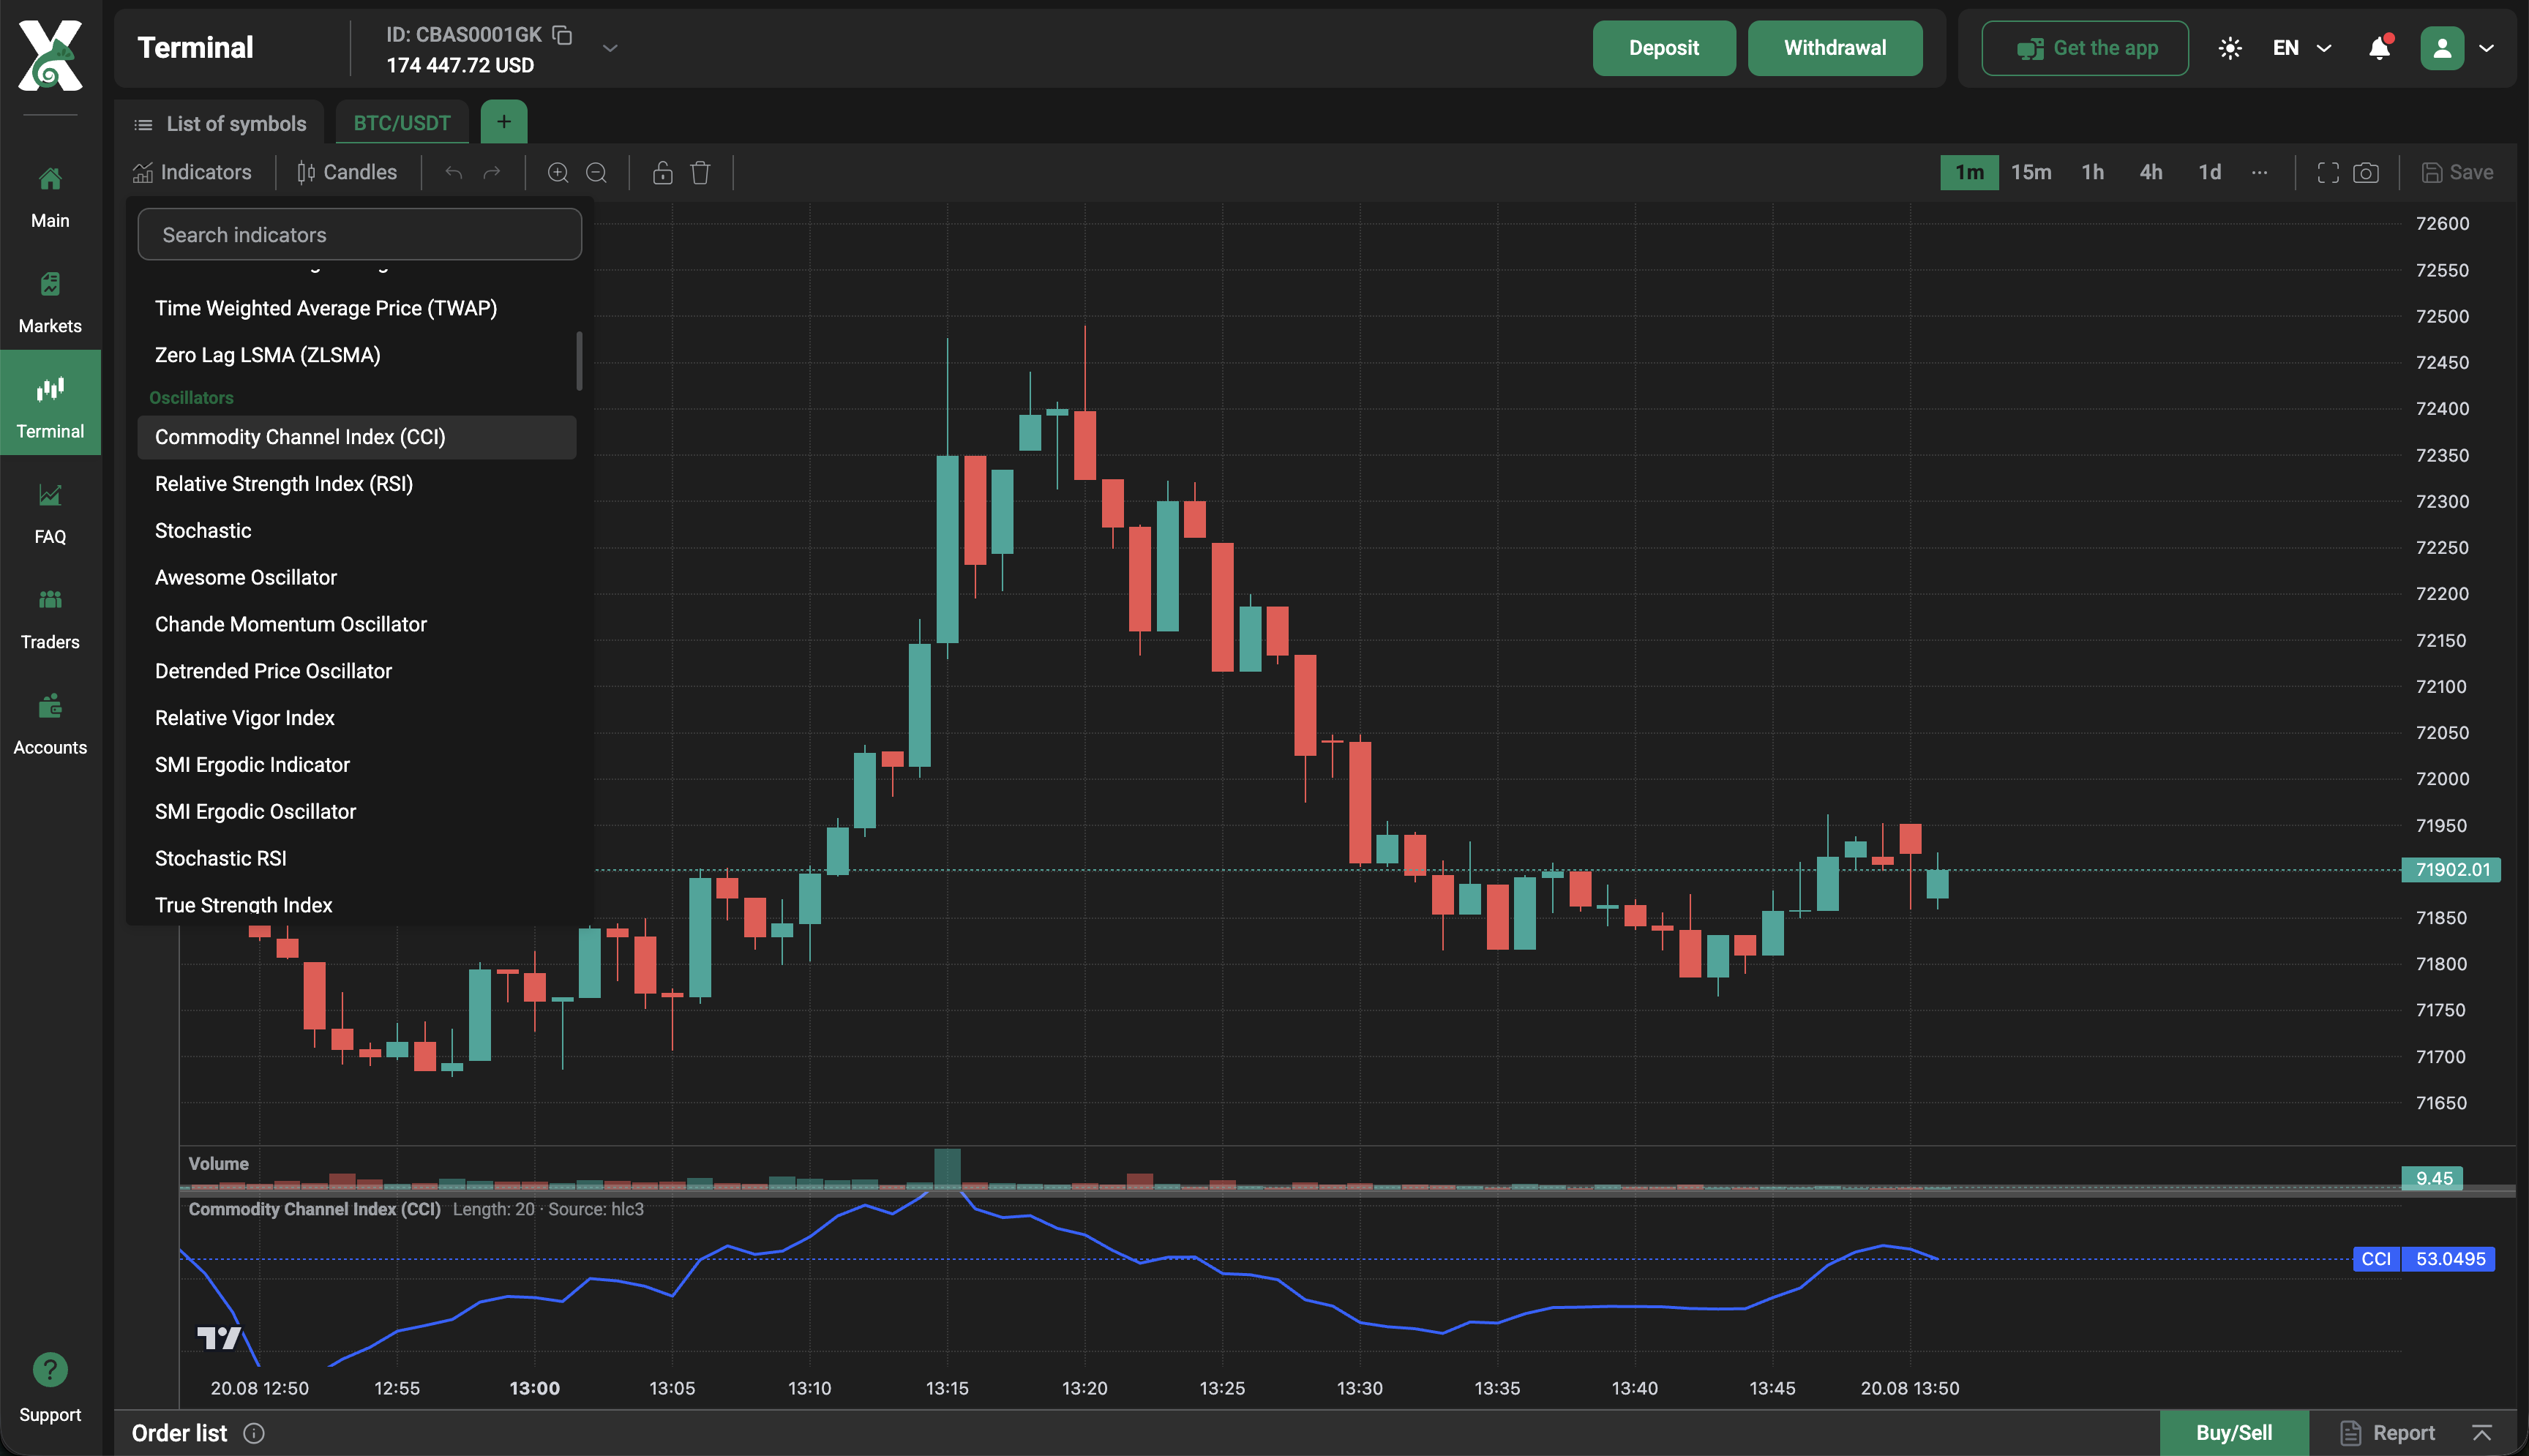
You can find the indicator in the Trading Terminal's Oscillators category. To display it on a chart:
-
Open the required trading instrument in the Terminal.
-
Click Indicators in the chart toolbar.
-
Find CCI under Oscillators.
-
Select the indicator.
A separate panel appears below the price chart, displaying the indicator's values.
In the example, CCI is applied to BTC/USDT with the following parameters:
-
Length: 20 – The number of candles included in the calculation.
-
Source: hlc3 – The average of the high, low, and closing prices.
As new price data becomes available, the indicator updates to reflect changes in market momentum.
Practical Considerations
Indicator signals depend on market conditions and the selected calculation period. During strong trends, overbought or oversold readings may persist without a reversal. Shorter calculation periods also increase sensitivity to price fluctuations and may generate more frequent false signals.
For a more complete market assessment, traders can combine CCI readings with support and resistance levels, price patterns, and trading volume.
Use the indicator as a supporting technical analysis tool rather than an independent basis for opening or closing trades.